
PACKINT - Chocolate Machines

2026 Best Turbidity Sensor for Water Quality Monitoring?

Choosing the best turbidity sensor in 2026 depends on where and how you monitor water. A municipal treatment plant, a river station, and a small aquaculture tank place very different demands on an instrument. A Turbidity Sensor estimates suspended particles by measuring how light interacts with a sample. Its reading can help operators track filtration changes, investigate cloudy water, and spot unusual trends. It does not identify contaminants or prove that water is safe to drink.

This guide compares the practical features that matter: measurement range, accuracy, response time, calibration needs, and resistance to fouling. Installation details count, too. A sensor mounted in a pipe may behave differently from one exposed to flowing river water, where bubbles, sediment, and changing light can affect readings. Look for clear maintenance instructions, accessible replacement parts, and support that matches your site. Small details matter.

No sensor is perfect. Even a well-specified model can produce misleading readings if it is poorly installed or rarely cleaned. That part is easy to underestimate. We will consider these limitations alongside performance claims, so you can judge which options suit your monitoring goals and operating conditions. Where possible, compare sensor readings with appropriate reference measurements before relying on them for decisions. A careful choice is not just about buying the most advanced model; it is about finding a dependable instrument your team can maintain and interpret consistently.
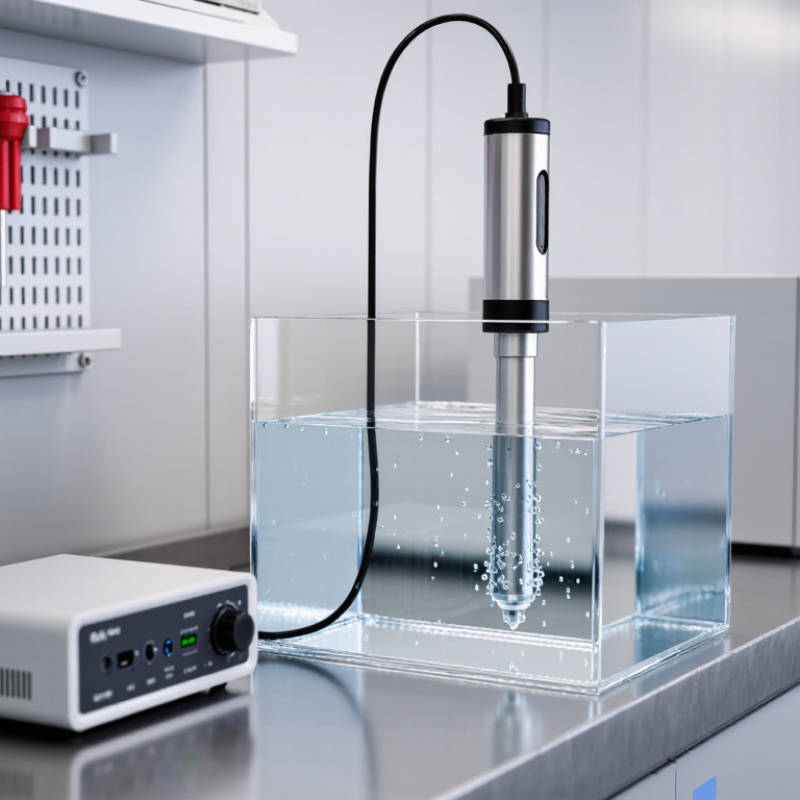
2026 Best Turbidity Sensor for Water Quality Monitoring?

Turbidity Sensors: Purpose and Role in Water Quality Monitoring

2026 Best Turbidity Sensor for Water Quality Monitoring?

Turbidity Sensors: Purpose and Role in Water Quality Monitoring

Turbidity sensors measure how particles scatter light through water, reporting results in nephelometric turbidity units (NTU). The reading can rise after rain washes soil into a stream, or when a treatment filter begins to fail. Operators use these changes to check source water, track filtration, and spot problems before water reaches storage. A sensor does not identify the particles. It signals that something has changed.

The U.S. Environmental Protection Agency’s Surface Water Treatment Rules set a useful benchmark: conventional and direct filtration systems must keep filtered-water turbidity at or below 0.3 NTU in at least 95 percent of monthly measurements, and never above 1 NTU. The World Health Organization’s Guidelines for Drinking-water Quality also note that low turbidity supports effective disinfection. These figures explain why steady monitoring matters. Small shifts can carry operational meaning.

Good data depends on more than the instrument. Bubbles, deposits on the optical window, and poor placement can distort readings. A field check matters. Compare sensor results with a calibrated reference, and clean the sensing surface on a regular schedule. Still, a clean number can be misleading if the sensor is overdue for calibration. Turbidity is one signal, not a complete water-quality assessment.

How Turbidity Sensors Measure Suspended Particles

A turbidity sensor estimates how much light suspended particles scatter, rather than counting each particle. In a common nephelometric design, a light beam passes through the sample and a detector reads scattered light at roughly 90 degrees. The U.S. EPA’s Method 180.1 describes this geometry and a measurement range of 0–40 NTU. ISO 7027-1:2016 also specifies optical methods, including infrared measurement. That sounds simple. Not quite. Particle size, color, bubbles, and sensor-window deposits can all shift the reading, even when the water looks unchanged.

For reliable monitoring, calibrate with appropriate standards and compare readings at a consistent location and flow rate. A sensor beside a pipe wall may see different conditions from one in the main flow. Wipe the optical window, check for trapped air, and record temperature or maintenance events alongside the data. The World Health Organization’s Guidelines for Drinking-water Quality note that turbidity should ideally be below 1 NTU before disinfection to support effective treatment. That value is a treatment objective, not a universal alarm threshold for every stream or process. One limitation is easy to miss: an NTU reading describes an optical response, not particle mass or identity. Use it with site-specific checks, especially after storms, when fine sediment can change quickly.

Key Criteria for Choosing a Turbidity Sensor in 2026

Choosing a turbidity sensor in 2026 starts with the water, not the catalog. A creek after rain carries coarse sediment; a treated-water line may need reliable readings near the low end. Match the sensor’s range and stated accuracy to expected conditions, then check whether performance is specified across that range. A wide range can look impressive. It may sacrifice detail where you need it most.

Look at optical design, response time, and maintenance demands. Wipers can help in water with biofouling, but they add moving parts and service needs. Confirm that calibration standards and replacement parts are accessible, and ask how the instrument handles bubbles, color, and changing ambient light. Check output compatibility, enclosure rating, mounting options, and data logging before installation. Bench performance is useful, but field behavior can be messier. That gap deserves attention.

Tips: Take paired readings during commissioning and compare them with a trusted reference method. Record water temperature, sampling location, and cleaning dates; those notes can explain odd shifts later. If readings drift, check fouling and bubbles before changing calibration. Keep one limitation in mind: no sensor removes the need for representative sampling.

2026 Best Turbidity Sensor for Water Quality Monitoring?

Key sensor-selection criteria: choose a measurement range that covers your operating conditions and verify performance at relevant turbidity levels.

The checkpoints span low to high turbidity for sensor-range evaluation. For conventional and direct filtration in the United States, the EPA treatment requirement is 0.3 NTU or less in at least 95% of monthly measurements, with a 1 NTU maximum. Requirements vary by treatment process and jurisdiction. Also compare accuracy, resolution, response time, cleaning needs, and output compatibility.

Comparing Sensor Types Across Water Monitoring Applications

Turbidity sensors do not measure every water sample equally well. Nephelometric sensors detect light scattered at an angle, often around 90 degrees. They suit relatively clear water, such as treated drinking water, where small changes matter. In a clean flow cell, readings can be steady. Bubbles or a scratched window can disrupt them.

TransmissIon Sensors measure how much light passes through a sample. They can be useful in process water with heavier suspended solids, but performance depends on particle size, color, and sensor path length. Backscatter sensors detect light reflected toward the source. Their wider measuring range can help in wastewater or sediment-rich rivers, though they may be less sensitive at very low turbidity. No sensor fits every site.

For rivers and reservoirs, field conditions deserve equal attention. Sunlight, algae, changing particle shapes, and biofilm on the optical window can all shift readings. A sensor that works in a laboratory may need frequent cleaning outdoors. That trade-off matters. Compare the expected turbidity range, response time, maintenance access, and calibration method before choosing a type. Check readings against grab samples during installation and after major changes in water conditions. One limitation remains easy to overlook: calibration cannot fully correct a poor match between the sensor’s optical design and the particles in the water.

2026 Best Turbidity Sensor for Water Quality Monitoring? — Comparing Sensor Types Across Water Monitoring Applications
Sensor type Measurement principle Typical measurement range Main strengths Limitations and considerations Best-fit applications Maintenance considerations
90° nephelometric, infrared light Measures light scattered at approximately 90°. Infrared designs commonly use a wavelength near 860 nm and are associated with ISO 7027 measurement methods. Commonly suited to low and moderate turbidity; the usable upper range depends on the instrument design and sample. Good sensitivity for relatively clear water; infrared measurement can reduce the influence of sample color compared with visible-light methods. Particle size, shape, and color can affect readings. Results may not match visible-light methods, and very turbid samples can exceed the useful range. Drinking-water treatment, treated-water monitoring, and clear-to-moderately turbid surface water. Keep the optical windows clean; check calibration with suitable standards and inspect for bubbles or deposits.
90° nephelometric, visible white light Measures visible light scattered at approximately 90°. EPA Method 180.1 is a recognized method using this general approach. Commonly used for low-to-moderate turbidity; the applicable range depends on the instrument and method. Established approach for many laboratory and water-treatment measurements; can be appropriate where a method specifies visible-light nephelometry. Water color and particle characteristics can influence results. Readings are not automatically interchangeable with infrared FNU results. Laboratory testing and applications that require a compatible visible-light method. Follow the applicable method for calibration, sample handling, vial cleanliness, and measurement procedure.
Backscatter Detects light scattered back toward the source, often at an angle greater than 90°. Some in-situ designs use multiple detectors or optical paths. Often selected for moderate-to-high turbidity, but the effective range varies substantially by design and particle conditions. Can remain useful in waters where a low-range 90° sensor may approach its upper limit; well suited to continuous in-situ measurement. Near-field particle effects, bubbles, fouling, and changing particle properties may affect readings. A site-specific correlation may be needed. Rivers, wastewater, stormwater, and process streams with changing or elevated suspended solids. Use an effective cleaning system where needed; inspect optical surfaces and verify readings against representative samples.
Transmission or attenuation Measures the reduction in light passing through a sample over a defined optical path. Often useful at moderate-to-high turbidity; performance depends on path length, optical design, and sample conditions. Can be useful when particle concentration is high enough to produce measurable light attenuation; supports continuous process monitoring. Less sensitive at very low turbidity; results can be affected by path length, particle settling, bubbles, and window fouling. Wastewater, industrial process water, and streams with higher suspended-particle loads. Keep both optical surfaces clean and check alignment, path condition, and calibration against the application’s reference method.
Multi-angle or multi-detector optical Combines measurements from multiple scattering angles and/or transmission channels to characterize a wider range of optical responses. May cover a broader range than a single-angle design, but the actual range and performance are model- and application-dependent. Additional optical information can improve measurement flexibility across changing turbidity conditions. More complex optics and signal processing do not guarantee better results in every water type; field validation remains important. Monitoring sites with wide or rapidly changing turbidity, where one optical geometry is insufficient. Follow the specified cleaning and verification schedule; confirm performance with samples representative of the monitoring site.

Selection note: There is no single best sensor type for every application. Compare the required measurement range, reporting method, water color, particle characteristics, deployment conditions, cleaning needs, and verification requirements. NTU and FNU results may differ because measurement geometry and light source affect the response; use the method required for the application and validate in the water being monitored.

Calibration, Installation, and Maintenance for Reliable Readings

Reliable turbidity readings start with calibration, not the display. Before installation, verify the sensor with clean water and certified turbidity standards that bracket the expected range. Record the standard values, temperature, date, and any adjustment.

The U.S. EPA’s Surface Water Treatment Rules require filtered water turbidity at or below 0.3 NTU in at least 95 percent of monthly measurements for many systems. That narrow target makes small calibration errors matter. Small details matter.

Install the probe where water mixes consistently, away from bubbles, sediment pockets, and direct sunlight. Keep the optical window clear of pipe walls and make room to remove the sensor for cleaning. A stable reading is useful; a stable but unrepresentative reading is not. The World Health Organization’s Guidelines for Drinking-water Quality note that turbidity should ideally remain below 1 NTU before disinfection, because particles can interfere with treatment. Check the instrument against this operating context, rather than assuming one sensor range fits every site.

Set a maintenance schedule based on fouling at the actual sampling point. Inspect the lens and wiper, remove deposits with a soft cloth, and avoid scratching optical surfaces. Compare field readings with a calibrated reference meter after cleaning or sensor replacement. Keep a log of drift, cleaning, and calibration results. I would still question a perfectly flat trend; real water changes, and sensors can quietly foul between visits. Source data: U.S. EPA Surface Water Treatment Rules, 40 CFR 141.173; WHO, Guidelines for Drinking-water Quality.

Article Source: